What Are the Politics of a Platform? What the Data Says About Content Moderation on X
Jonathan Stray / Apr 8, 2026This post is part two of a three-part series. Part one examined the political composition of X's user base. This part takes up content moderation: what policies changed, how much hate speech is on the platform, and what we can and cannot know about such questions. Part three will investigate whether X's algorithm itself is biased toward the right.

March 30, 2026—Despite multiple vandalism attempts, artwork including a giant bust of Elon Musk, a DOGE painting on giant plywood along with a painting of Musk himself sits along the route to Starbase, the controversial new city around the billionaire's SpaceX Starbase South Texas Launch Site. (Photo by Laura Brett/Sipa USA)(Sipa via AP Images)
When Elon Musk acquired Twitter, he promised expansive freedom of speech, so it was no surprise when he loosened content moderation policy and reinstated thousands of previously banned accounts. No one disagrees with that. A much more difficult question is what effect this had on the platform, and how we could even know with any degree of precision.
Musk and X repeatedly claimed that hate speech went down post-acquisition,and that the platform's new "freedom of speech, not freedom of reach" approach is working, suppressing hateful content algorithmically even when it isn't removed. Researchers, civil society organizations, and EU officials pushed back, pointing to study after study showing hate speech went up.
Both sets of claims may be correct. The disagreement may largely reflect a measurement difference: external researchers can only really measure how many hateful posts were produced; Musk claimed to reduce hateful impressions. Whether the platform's demotion system actually reduced how often users saw hate speech is a question that requires internal data—data that X has never shared and has made it harder to obtain. This article lays out what the available evidence actually shows, and where it stops.
How content moderation changed
The most granular public record of X's policy changes comes from the Platform Governance Archive, which tracks edits to platforms' help center documents. An analysis by the Humboldt Institute for Internet and Society (HIIG) published in October 2024 provides the clearest overview.
Within days of the acquisition, X dropped its COVID-19 misinformation policy and stopped removing “hateful” content, algorithmically suppressing it instead. A general amnesty reinstated most previously suspended accounts, and the Trust and Safety Advisory Council was disbanded. Later, in April 2023, restrictions around misgendering or deadnaming transgender individuals were removed. A few months later, the crisis misinformation policy (covering false information about armed conflict, public health emergencies, and natural disasters) was removed along with the election integrity policy (covering unverified claims of election fraud and premature victory declarations).
The removal of the election integrity and crisis misinformation policies were substantial changes; these applied to some of the most controversial types of content to moderate, after Twitter blocked links to the Hunter Biden laptop story in October 2020, and restricted other types of content in the aftermath of the 2020 election. Yet through all this, the core definitions of “hate speech” and other violating content remained essentially unchanged (with the exception of misgendering and deadnaming). As HIIG put it,
Although X’s definitions of permitted and prohibited content have remained largely consistent across many policy areas, the consequences for violations have shifted significantly.
The result was "a noticeable shift towards softer sanctions across different policy areas," not an elimination of all rules (and if you really want to get granular, this is the PDF for you). The basic question is whether those softer sanctions produced harsher outcomes.
Is hate up or down?
When it comes to this question, it depends what you measure. Most attempts consider posts, impressions, and removals. It’s hard to define “hate speech,” and on top of that there are the algorithmic questions of how to define it for a computer. I’ll try to briefly explain what each of the available datasets are actually measuring, and keep using quotation marks around “hate” to convey the many normative choices inherent in the use of that word.
Almost every external analysis of the volume of hate speech on X relies on counting posts, either by using a monitoring platform like Brandwatch, or simply counting items in the platform’s search results. This usually means that “hate” ends up being defined by a list of keywords. The first such study found that “hate-terms” went from 84 hate-term tweets per hour in the week preceding acquisition to 398 per hour after midnight on October 28, the day after it closed. This soon died down significantly, perhaps near to baseline levels. A more comprehensive data set covers March 2022 to January 2023. This one also starts with keyword matches, but also included—by manual classification—whether the use of “hate words” was “hateful” (“You [bleep]!” vs “I just got called a [bleep]”).
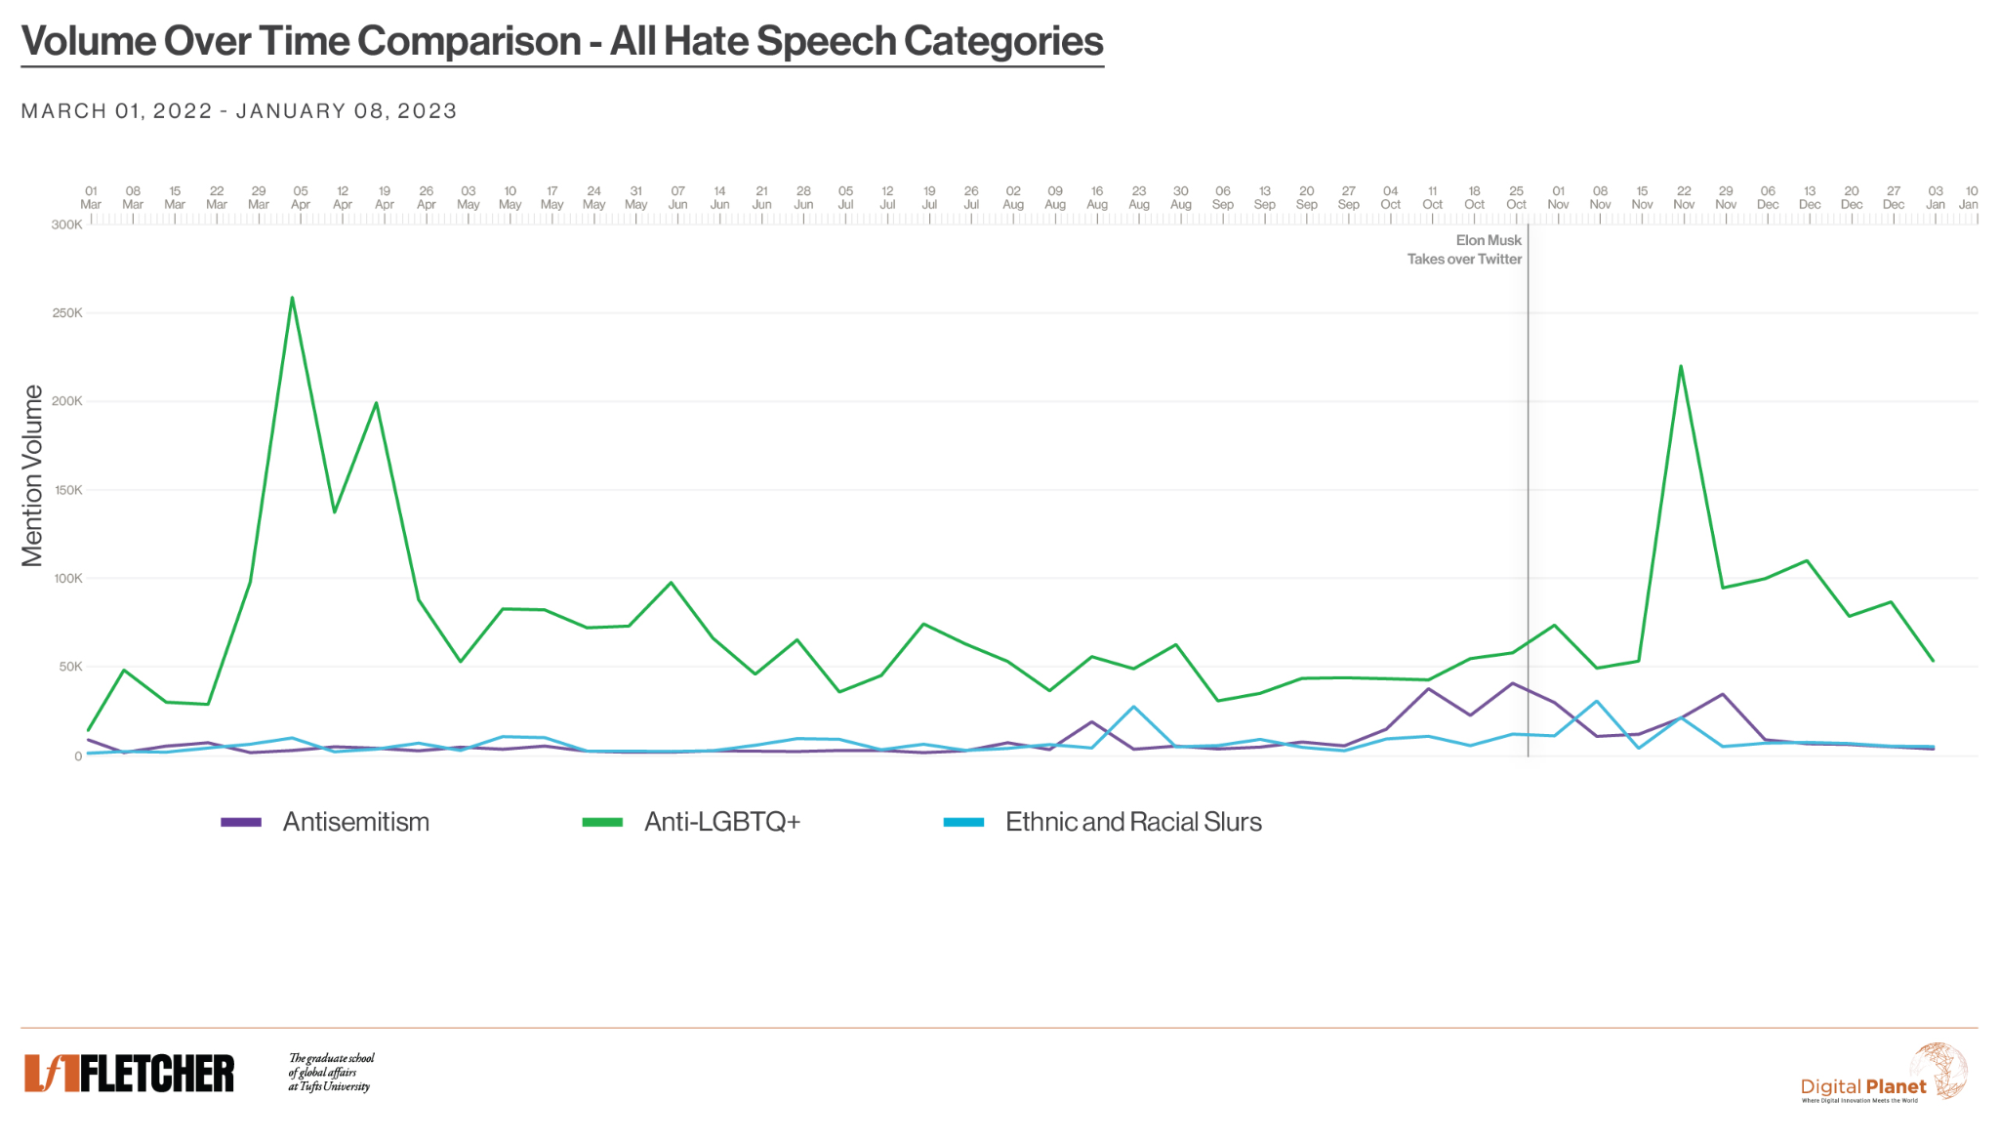
Data from Fletcher School at Tufts University/Digital Planet
The data reveals people changing their behavior in anticipation of the acquisition, using more slurs some weeks before the change. The first peak in anti-LGBTQ+ posts in the Spring of 2022 (pre-Musk) was largely driven by the word “groomer” and coincided with discussion of the “Don’t Say Gay” bill. The upshot here is that the acquisition did have an effect, but it seems it was somewhat temporary and possibly not larger than the effects of contemporaneous political events.
Another post-counting study used “a suite of … classifiers trained to identify antisemitic content in line with the IHRA definition.” This found a general increase that did not collapse back to baseline, at least not by February 2023.
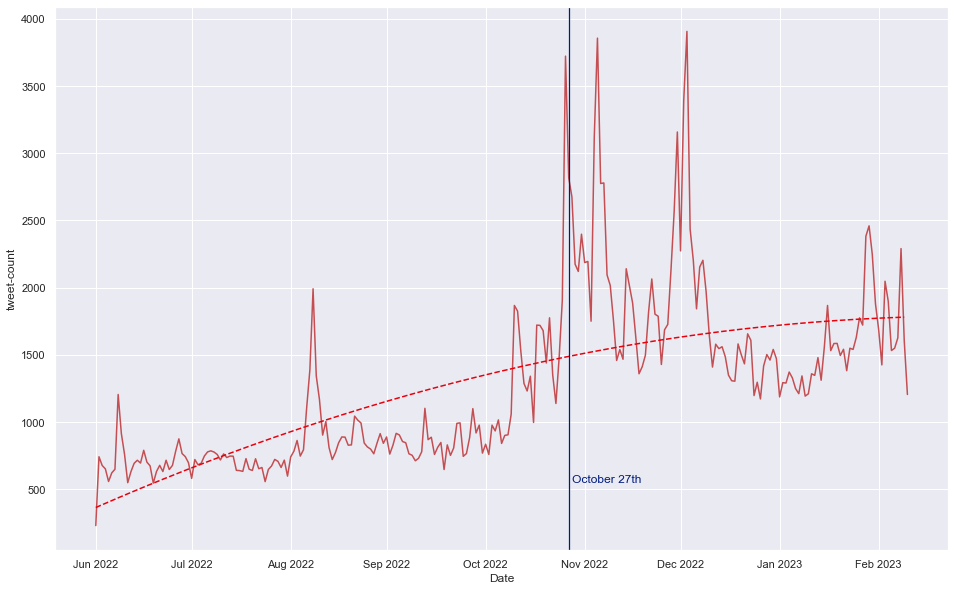
Volume of potentially antisemitic tweets over time, June 2022–February 2023. ISD/CASM Technology
Crucially, this study also measured engagement per post, meaning likes and retweets, and found no change after the acquisition. If Musk's "freedom of reach" demotion system was working, you would have expected engagement per “hate post” (in this case antisemitic posts) to fall.
The best data we have on this comes from a peer-reviewed study by Hickey et al. which goes to June 2023. The authors used Google’s Perspective API to identify toxic posts and compared rates of “hate” posts to a baseline sample of random posts to account for potential user activity changes over this period. The headline is that hate speech posts were up approximately 50% in the post-acquisition period. But then hate posting collapsed in the summer of 2023.
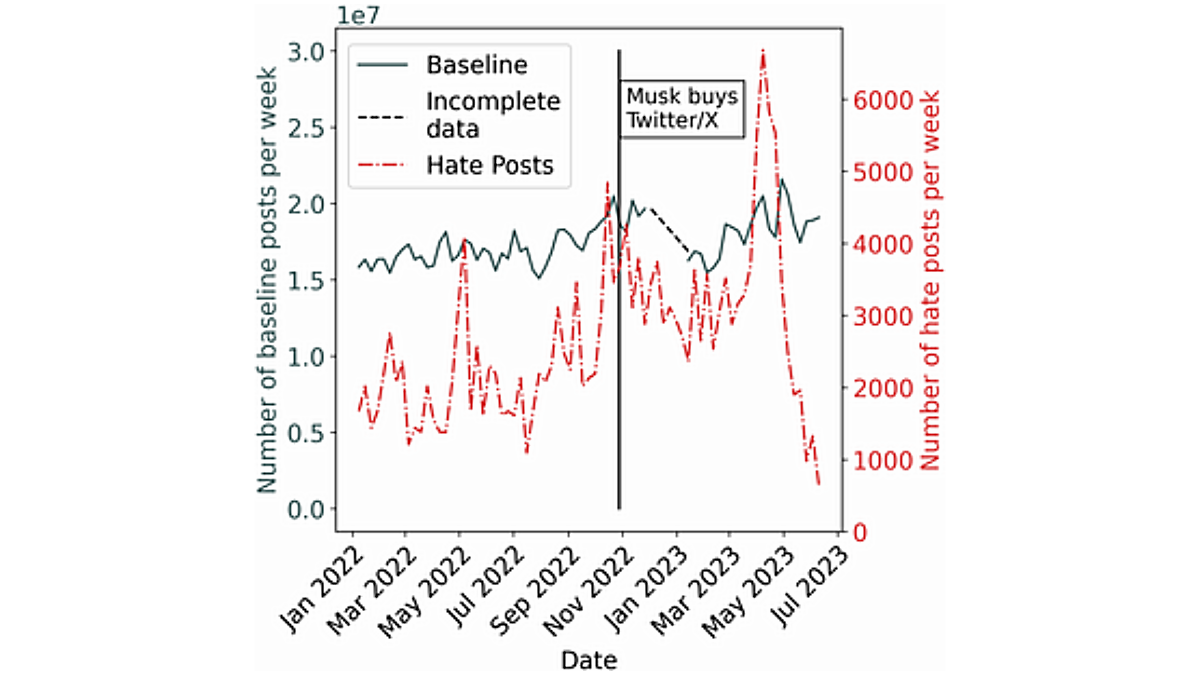
Weekly hate speech volume on X, January 2022–June 2023. The vertical line marks Musk's acquisition. Hickey et al. 2025
That spike in April 2023 was probably driven by the Dylan Mulvaney backlash after the Bud Light post (the company paid a trans influencer for an endorsement). Once again, the acquisition had an effect but political events seem to have mattered more. Also, “hate” posts started rising before the policy changes, meaning that we can’t cleanly separate what Musk did from what the users did.
However, this study also found that the number of likes on “hate” posts rose by 70%. That again suggests that there wasn’t less reach, contradicting the new speech-not-reach policy. (Engagements are just a proxy for impressions, but X added public impression data shortly after the acquisition, so we know that total views are approximately a fixed multiple of engagements.)
Musk's impression data
Musk's counter-evidence consists of two graphs. On November 23, 2022, he tweeted: "Hate speech impressions down by 1/3 from pre-spike levels" with this graph:
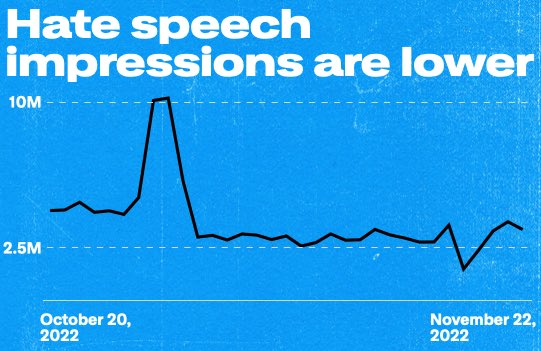
He posted this graph again on December 2, saying "Hate speech impressions (# of times tweet was viewed) continue to decline, despite significant user growth!" and promising that the @TwitterSafety team would release this data “weekly.” It does not appear that they did; the only further data I could find was this graph from March 2023:
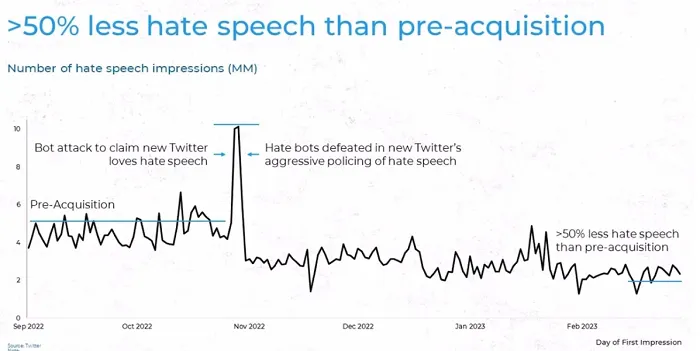
These are the only charts available that are based on actual impression data, because only X has access to full impression data. Unfortunately, no methodology was ever provided, nor a definition of hate speech.
What we do have is a March 2023 analysis of all public posts by analytics firm Sprinklr. Twitter made its internal list of over 300 slurs available to Sprinklr, and the company analyzed every post with one of these words from January and February 2023. They found that “toxic” posts received ⅓ of the engagement of “non-toxic” posts.
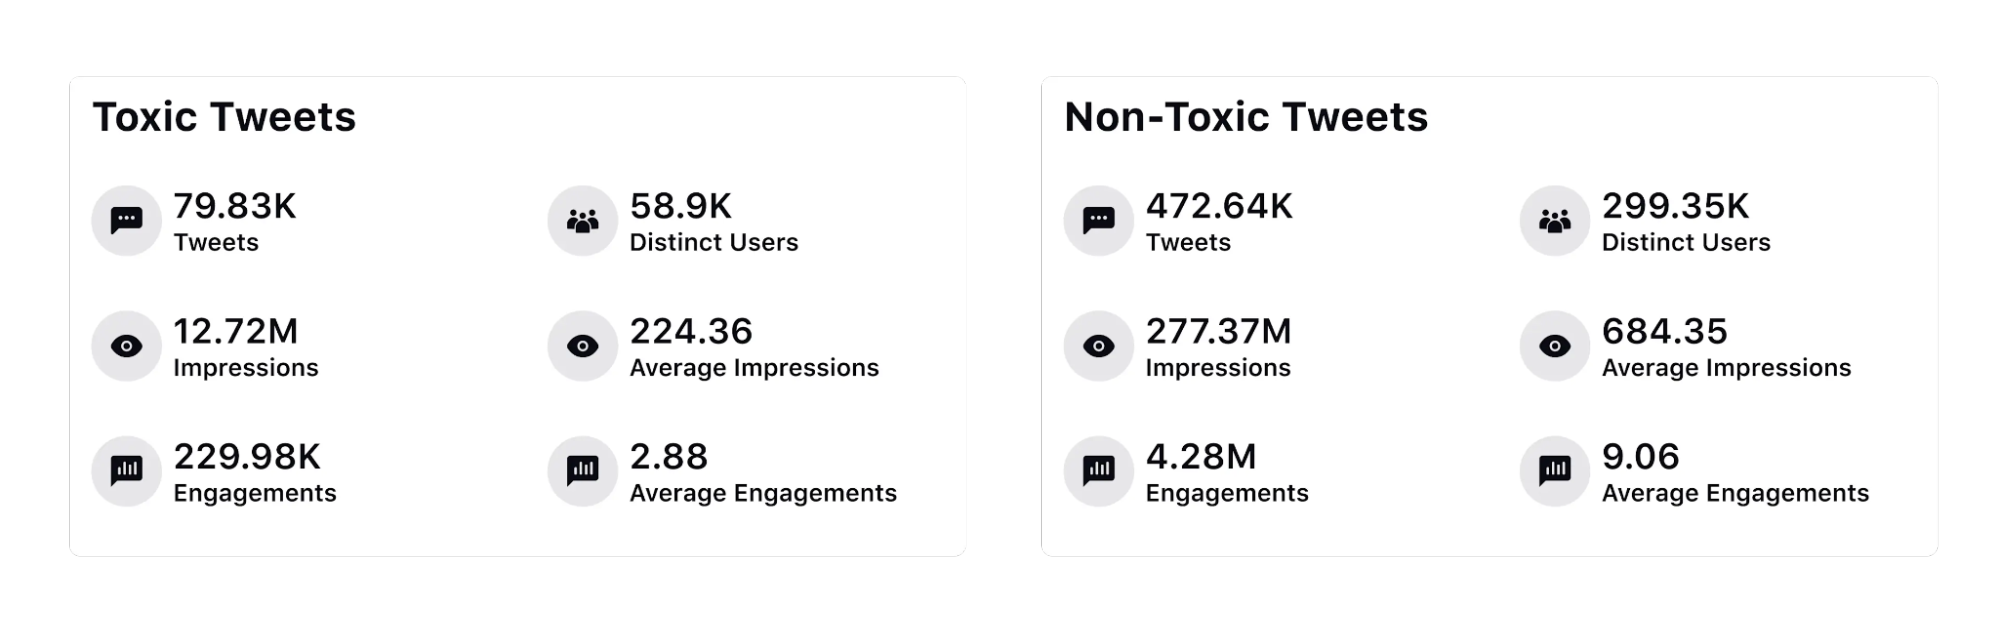
The @TwitterSafety team said Sprinklr found even lower numbers of “hate” impressions than they did, because Sprinklr used a context-sensitive classifier while Twitter counted simple keyword occurrences. Confirming this, Sprinklr said it found a lot of false positives from its slur search.
This appears to be direct evidence for the speech-not-reach policy working as advertised. The external findings that found evidence against this claim are most likely measuring somewhat different definitions of “hate,” or examining a different time period. Relatedly, this graph only goes through February 2023. It might therefore be perfectly compatible with the trends as in the Hickey graph (above), which also shows a reduction through February—but then a big spike in late March, corresponding to the Bud Light boycott.
There’s one final impressions data point from X in a July 2023 post that says:
Labels have been applied to more than 700,000 violative posts that fall under our Hateful Conduct policy. … Compared to a healthy post, posts with these labels—or restricted posts— receive 81% less reach or impressions and we proactively prevent ads from appearing adjacent to content that we label.
This 81% figure is in the same order of magnitude as Sprinklr’s 66% reduction in impressions.
X has finally started publishing transparency reports again, which show a fall in account suspensions for “hate speech” from 104,565 (first half of 2022) to 2,326 (second half of 2024). But so far, X hasn’t published more “hate” impressions data.
What happens when a user reports a post?
Two reports from the Center for Countering Digital Hate measured not the volume of hate speech but whether X acted on it when reported. This is a different question again—about enforcement rather than prevalence.
In June 2023, CCDH flagged posts from 100 users and found that the platform failed to act on 99% of “hateful” posts as of four days later. In September 2023 they reported 300 more posts and found 86% still up a week later, including ones pertaining to Holocaust denial and calls for racial violence.
These studies say nothing about volume or impressions. They specifically test the user reporting mechanism and its connection to content removal. This is a tricky thing to get right, as users will gang up to censor each other if the “report” button is too closely connected to post removal.
That September CCDH report also found major brand ads running adjacent to “hateful” content. X sued CCDH on the basis that the organization illegally scraped data and that these “cherry-picked” examples mis-represented the X user experience. The case was dismissed in March 2024, when the judge wrote that the lawsuit was "about punishing the Defendants for their speech.” X appealed in April 2025.
What we know and what we can't
So there you have it. Measures of hate speech production spiked substantially after Musk's acquisition, then settled down again—eventually, and perhaps not in all categories at the same rate. Musk says impressions spiked but then settled at lower levels than pre-acquisition, maybe half as much. There is one external analysis that confirms this impressions story for January-February 2023. It’s quite possible all of these narratives are simultaneously true. Everyone is using different definitions of “hate,” so it’s hard to tell.
Generally speaking, I suspect measuring impressions is the right way to assess the effects of “hate” speech, because the mere existence of hateful words in a post doesn’t indicate they are harmful. The internet is and always will be full of awful things, for those who go looking. Unfortunately, this is also the hardest statistic to measure from the outside. Impressions data is included in the X API, and sampled versions of the full firehose are available in Enterprise plans—starting at $42,000 per month. So in theory, anyone could track these numbers, but it would be terrifically expensive. With the death of the Academic API, the platform made itself unmeasurable shortly after it changed its policies.
Notably, the European Commission decided in July 2024 that X does not comply with its researcher data access obligations under the Digital Services Act (DSA), and then fined the company €120 million for this and two other DSA breaches.
Meanwhile, if anyone inside the platform has conducted further measurements on “hate,” they haven’t reported any of it. Scattered transparency reports do tell a tale of fewer account removals under the new regime, sometimes many fewer. Perhaps this is what one would expect from the softer “downrank don’t delete” policy—if it’s not serious enough to delete, then it’s not serious enough to get you suspended.
Both internal and external observers seem to have lost interest in the question since mid-2023, so in the end we know very little. The most honest summary: hate speech production clearly went up post acquisition, at least temporarily. Whether hate speech consumption also went up is a question only X can answer, and it hasn’t answered it in any consistent or verifiable way. We can only hope that the DSA eventually provides some relief for external researchers, at least in Europe.
In part three, we'll look at the algorithm itself: the evidence for and against the claim that X's recommendation system is biased toward right-wing content.
Authors